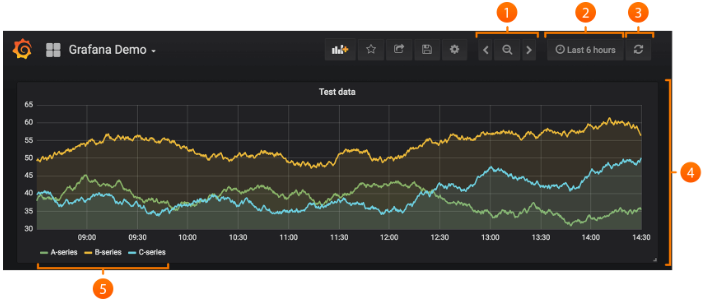
Dashboard Genel Görünüm
Örnek bir dashboard şöyleAçıklaması şöyle1.Zoom out time range2. Time picker dropdown. Here you can access relative time range options, auto-refresh options and set custom absolute time ranges.3. Manual refresh button. Will cause all panels to refresh (fetch new data).4. Dashboard panel. Click the panel title to edit panels.5. Graph legend. You can change series colors, y-axis and series visibility directly from the legend.
1. Dashboard'a birden fazla satır eklenebilir.
2. Her satırda bir veya daha fazla panel bulunur.
Paneller için açıklama şöyle
The panel is the basic visualization building block in Grafana. Each panel has a query editor specific to the data source selected in the panel. The query editor allows you to extract the perfect visualization to display on the panel. With the exception of a few special use panels, a panel is a visual representation of one or more queries. The queries display data over time. This can range from temperature fluctuations to current server status to a list of logs or alerts. In order to display data, needs to have at least one data source added to Grafana.There are a wide variety of styling and formatting options for each panel. Panels can be dragged and dropped and rearranged on the dashboard. They can also be resized.Drag and drop panels by clicking and holding the panel title, then dragging it to its new location. it can also easily resize panels by clicking the (-) and (+) icons.
Templates and variables
Açıklaması şöyle
A template is any query that contains a variable.For example :wmi_system_threads{instance=~"$server"}
Variable syntax
Açıklaması şöyle
Panel titles and metric queries can refer to variables using two different syntaxes:- $varname This syntax is easy to read, but it does not allow users to use a variable in the middle of a word. Example: apps.frontend.$server.requests.count- ${var_name} Use this syntax when the user wants to interpolate a variable in the middle of an expression.- ${var_name:<format>} This format gives users more control over how Grafana interpolates values.- [[varname]] Do not use it. Deprecated old syntax, will be removed in a future release.Before queries are sent to the data source the query is interpolated, meaning the variable is replaced with its current value. During interpolation, the variable value might be escaped in order to conform to the syntax of the query language and where it is used. For example, a variable used in a regex expression in an InfluxDB or Prometheus query will be regex escaped. Read the data source specific documentation topic for details on value escaping during interpolation.Variable values are always synced to the URL using the syntax var-<varname>=value.
Variable best practices
- Variable drop-down lists are displayed in the order they are listed in the variable list in Dashboard settings.- Put the variables that you will change often at the top, so they will be shown first (far left on the dashboard).
Örnek
Şöyle yaparız. Burada $__timeFilter bir değişken. Grafana dashboard ile seçili zaman aralığını temsil ediyor.
SELECTUNIX_TIMESTAMP(date_format(created_date,'%Y-%m-%d %H:%i')) as time_sec,count(*) as value,variable_name as metricFROM dashboard.service_response_timeWHERE $__timeFilter(created_date)GROUP BY time_sec,variable_nameORDER BY time_sec ASC;
Dashboard Başlığı
Şeklen şöyle
Açıklaması şöyle
1. Side menubar toggle: This toggles the side menu, allowing you to focus on the data presented in the dashboard. The side menu provides access to features unrelated to a Dashboard such as Users, Organizations, and Data Sources.2. Dashboard dropdown: This dropdown shows you which Dashboard you are currently viewing, and allows you to easily switch to a new Dashboard. From here you can also create a new Dashboard or folder, import existing Dashboards, and manage Dashboard playlists.3. Add Panel: Adds a new panel to the current Dashboard4. Star Dashboard: Star (or unstar) the current Dashboard. Starred Dashboards will show up on your own Home Dashboard by default, and are a convenient way to mark Dashboards that you’re interested in.5. Share Dashboard: Share the current dashboard by creating a link or create a static Snapshot of it. Make sure the Dashboard is saved before sharing.6. Save dashboard: The current Dashboard will be saved with the current Dashboard name.7. Settings: Manage Dashboard settings and features such as Templating and Annotation
Time range controls
Şeklen şöyle
"Last X" şeklinde göreceli veya "Absolute Time" şeklinde mutlak zaman girilebilir.


Hiç yorum yok:
Yorum Gönder