Giriş
Açıklaması şöyle
Prometheus is an open-source monitoring system that helps to periodically monitor the JVM Based systems.
Prometheus Sunucusu
Prometheus Sunucusu genellikle 9090 portunu dinleyecek şekilde çalıştırılıyor. prometheus.yml dosyasında sorgulanacak spring boot uygulamasını adresi ve ne kadar sıklıkla sorgulanacağı (poll) belirtiliyor.
Prometheus aldığı değerleri de bir time series veri tabanına kaydeder. Böylece veriler kaybolmaz. Veriyi görmek için Prometheus sunucusunun çalıştığı şu adrese gideriz. Ekran görüntüsü burada
http://localhost:9090/
Bir metric seçip "Execute" düğmesine tıklarsa karşımıza bir grafik çıkar
Metrics Adresi
Şu adrese gideriz
localhost:9090/metrics
Çıktısı şöyle
# HELP go_gc_duration_seconds A summary of the pause duration of garbage collection cycles.
# TYPE go_gc_duration_seconds summary
go_gc_duration_seconds{quantile="0"} 1.3545e-05
go_gc_duration_seconds{quantile="0.25"} 1.6924e-05
go_gc_duration_seconds{quantile="0.5"} 3.8626e-05
go_gc_duration_seconds{quantile="0.75"} 4.503e-05
go_gc_duration_seconds{quantile="1"} 0.000437923
...
Prometheus Exporter
Açıklaması şöyle
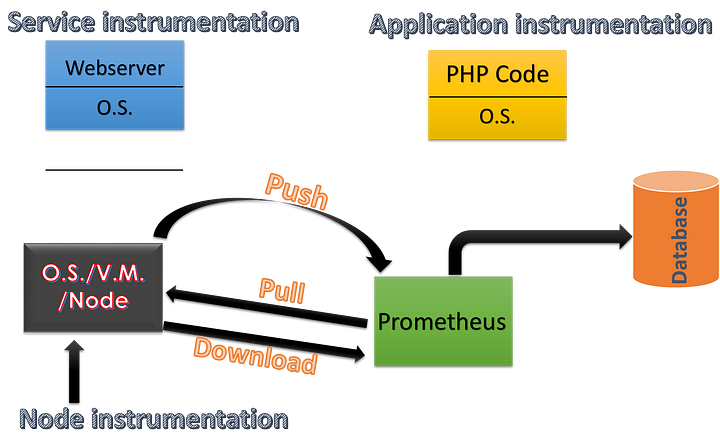
Prometheus is an exporter based monitoring tool that means on target machine a exporter is installed that takes the target machine health and then Prometheus server pulls that data from exporter. These data are called Metrics. The pulling of metrics happens over HTTP then Prometheus server scrapes the metrics from web.
Açıklaması şöyle
Exporters are standalone applications in the Prometheus ecosystem that exposes metrics for third-party systems that cannot be scraped easily.Why do we need Exporters? Because some third-party systems have their internal states but Prometheus server cannot consume those data. To overcome this issue, Exporters are developed by a large number of Community contributors or organizations to export the internal state of third-party systems to a format that Prometheus can consume.
- Örneğin node_exporter işletim sistemini detaylarını Prometheus'a göndermek içindir. Hedef bilgisayarda çalışır
Service Discovery
Açıklaması şöyle
Service Discovery allows Prometheus to discover machines and/or services running somewhere. It can be anything that contains or returns a list of targets, such as a JSON file or an HTTP endpoint or as complex as Kubernetes API.Why do we need service discovery? Because Prometheus reads all configuration from the configuration file at boot time, while the targets may come and go after Prometheus booted. To overcome this issue, Prometheus need to dynamically load this extra bit of information in runtime.
Graph Adresi
Şu adrese gideriz

url : http://localhost:9090/graph
search by “process_cpu_usage”
Targets Adresi
Şu adrese gideriz. Scrape edilen hedefleri gösterir.
http://localhost:9090/targets
Örnek
Şeklen şöyle. Burada yaml dosyasında "job-name" alanında belirtilen spring uygulaması gösteriliyor.

Örnek
Şeklen şöyle. Burada yaml dosyasında "job-name" alanında belirtilen Jenkins uygulaması gösteriliyor.

Prometheus'u başlatmak için "./prometheus" komutu çalıştırılır
-- config.file seçeneği
Şöyle yaparız
prometheus \
  --config.file=/etc/prometheus/prometheus.yml
  --web.config.file=/etc/prometheus/web-config.yml
--version seçeneği
Şöyle yaparız
prometheus --version
prometheus, version 2.39.0 (branch: HEAD, revision: 6d7f26c46ff70286944991f95d791dff03174eea)
  build user:       root@bc053716806f
  build date:       20221005-05:09:43
  go version:       go1.19.1
  platform:         linux/amd64
Promtool komutu
Prometheus konfigürasyonunu doğrulamak için kullanılır.
PromQL yazısına taşıdım
Pushgateway
Şeklen şöyle

Açıklaması şöyle
It uses a feature called a Pushgateway that lets you push time series metrics data to it in cases where data cannot be scraped or pulled.
Açıklaması şöyle
Pushgateway is a standalone application in the Prometheus ecosystem that exposes metrics for ephemeral and batch jobs that can’t be scraped.We do we need Pushgateway? Because the lifecycle of those jobs are too short for Prometheus continuously scraping metrics. Instead, those jobs push metrics to pushgateway and then Prometheus scrapes metrics from pushgateway. Note that Pushgateway does not change the “pull” model of Prometheus server.
Basic authentication için şöyle yaparız. Şifre bcrypt ile şifrelidir
basic_auth_users:
  {your_desired_username}:{your_encrypted_password}
prometheus.yml
prometheus.yml yazısına taşıdım
alert_rules.yml
Bu dosyada alarm durumu tanımlı. Belli bir eşik aşılınca alert gönderilir. Şeklen şöyle
docker/
├─ alert-manager/
│ ├─ config/
│ │ ├─ alertmanager.yml
├─ grafana/
│ ├─ grafana.ini
├─ prometheus/
│ ├─ config/
│ │ ├─ alert-rules.yml
│ │ ├─ prometheus.yml
docker-compose.yaml
prometheus.yml dosyasında alert-rules dosyası şöyle belirtilir
rule_files:
  - 'alert-rules.yml'
alerting:
  alertmanagers:
    - scheme: http
    - static_configs:
        - targets: ['host.docker.internal:9093']
Örnek
alert-rules.yml şöyledir
groups:
  - name: tutorial-rules
    rules:
      # Triggers a critical alert if a server is down for more than 1 minute.
      - alert: ServerDown
        expr: up < 1
        for: 1m
        labels:
          severity: critical
        annotations:
          summary: "Server {{ $labels.instance }} down"
          description: "{{ $labels.instance }} of job {{ $labels.job }} has been down for more than 1 minute."
Açıklaması şöyle
Inside the alert-rules.yml file, under the groups section, we've created a named group called tutorial-rules. This group holds the instructions for our rules. Here’s a breakdown of what’s happening with our example rule:alert: ServerDown: This line assigns a name to our alert, 'ServerDown'. It's like a label for the alert, helping us identify what's going on.expr: up < 1: This line is the heart of the rule. It defines the condition for the alert. In simple terms, it checks if the 'up' metric (which tells us if a server is running) is less than 1. If it's less than 1, it means the server is down. You can find more examples of query basics here.for: 1m: This part tells Prometheus to wait for 1 minute before triggering the alert. It gives a little time, just in case the server goes down briefly.labels:: These are like tags we attach to the alert. In our case, we're labeling the severity as 'critical'.annotations:: These are additional details we add to the alert. The summary and description lines help us understand the situation better. They tell us which server and job are affected and how long the server has been down.
Örnek
Bir örnek burada
Docker
Prometheus Docker yazısına taşıdım
Compose Dosyası
Docker Compose yazısına taşıdım
AlertManager
Açıklaması şöyle
Prometheus doesn’t require any agents or applications to be installed on your server fleet in order to collect data, and it leverages a component called AlertManager, which manages alerts and sends notifications via email, on-call systems, and/or group collaboration tools like Slack.
Açıklaması şöyle
Prometheus server as a client application runs alert rules periodically and push alerts to Alertmanager. Alertmanager then takes care of deduplicating, grouping, and routing them to the correct receiver integrations.Why do we need Alertmanager? There is no clear answer though but I think it is due to trade-off. We could have built the alerting functionality into Prometheus server but that have a drawback. Due to the distributed nature of Prometheus server, alerts coming from different Prometheus servers could be fired even they have very similar information. Features like deduplicating needs some form of consensus. Introducing consensus algorithm implementation into Prometheus server significantly increases the complexity and maintenance overhead. Instead, the decision was to introduce a central component “Alertmanager” to deal with these features.
AlertManager kendi başına bir uygulama. Eğer alert olursa bunu e-posta, Slack gibi bir kanala göndermek içindir. Bir örnek burada.
AlertManager uygulamasının çıktısını görmek için şu adrese gideriz.
http://localhost:9093/#/alerts
alertmanager.yaml Dosyası
alert-rules.yaml ile belirtilen alert durumunun nasıl gönderileceği bu dosyada tanımlı
Örnek - Telegram + E-Posta
Şöyle yaparız
route:
  receiver: tutorial-alert-manager
  repeat_interval: 1m
receivers:
  - name: 'tutorial-alert-manager'
    telegram_configs:
      - bot_token: tutorial_token
        api_url: https://api.telegram.org
        chat_id: -12345678
        parse_mode: ''
    email_configs:
      - to: 'tutorial.inbox@gmail.com'
        from: 'tutorial.outbox@gmail.com'
        smarthost: 'smtp.gmail.com:587'
        auth_username: 'username'
        auth_password: 'password'
Açıklaması şöyle
Here, receiver points to the name of the receiver you're setting up. The repeat_interval specifies how often to send repeat notifications, ensuring crucial alerts aren't missed. Our example illustrates the use of two distinct receivers.
- The first receiver is configured to send alerts via Telegram. It uses the provided bot token, chat ID, and Telegram API.
- The second receiver is set up for email notifications. In this configuration, we specify an email receiver that sends notifications to a specified email address. You will need to replace the placeholder values (tutorial.inbox@gmail.com, tutorial.outbox@gmail.com, smtp.gmail.com:587, username, password) with your own email and SMTP server details.
Hiç yorum yok:
Yorum Gönder